Creating a custom tile set with Mapbox Tile Server
Mapbox is sponsoring a Maptober challenge to teach users how to create their own map vector tilesets. When you load a map you see roads, borders, place names, bodies of water and much more. But what if you wanted to include your own features on the map? They could be trees or something abstract like the path you take when you swim across a lake.
For the challenge, I decided to map my Strava activities. I have gone running, climbing and skiing in a few different places this year and I wanted to picture it all on a single map. I wrote a program to export my last 200 activities into GeoJSON format, which is required for creating custom map tiles. The GeoJSON contains latitude and longitude points along the route I took as well as some metadata like the total distance and elevation gain. Here’s a truncated sample:
{
    "type": "Feature",
    "geometry": {
        "type": "LineString",
        "coordinates": [
            [-122.264921, 47.758042],
            ... much data omitted ...
            [-122.274762, 47.754073]
        ]
    },
    "properties": {
        "name": "Miler ",
        "distance": 2418.9,
        "moving_time": 727,
        "elapsed_time": 751,
        "total_elevation_gain": 0,
        "type": "Run",
        "id": 5887824150,
        "start_date": "2021-09-01T13:25:46Z",
        "start_latlng": [47.758042, -122.264921],
        "end_latlng": [47.754073, -122.274762],
        "start_latitude": 47.758042,
        "start_longitude": -122.274762,
        ... more data omitted
    }
}
Next, I uploaded the activities as a data source to the Mapbox Tiling Service but each activity looked like a wisp of hair when zoomed out. You can barely make them out here in red:

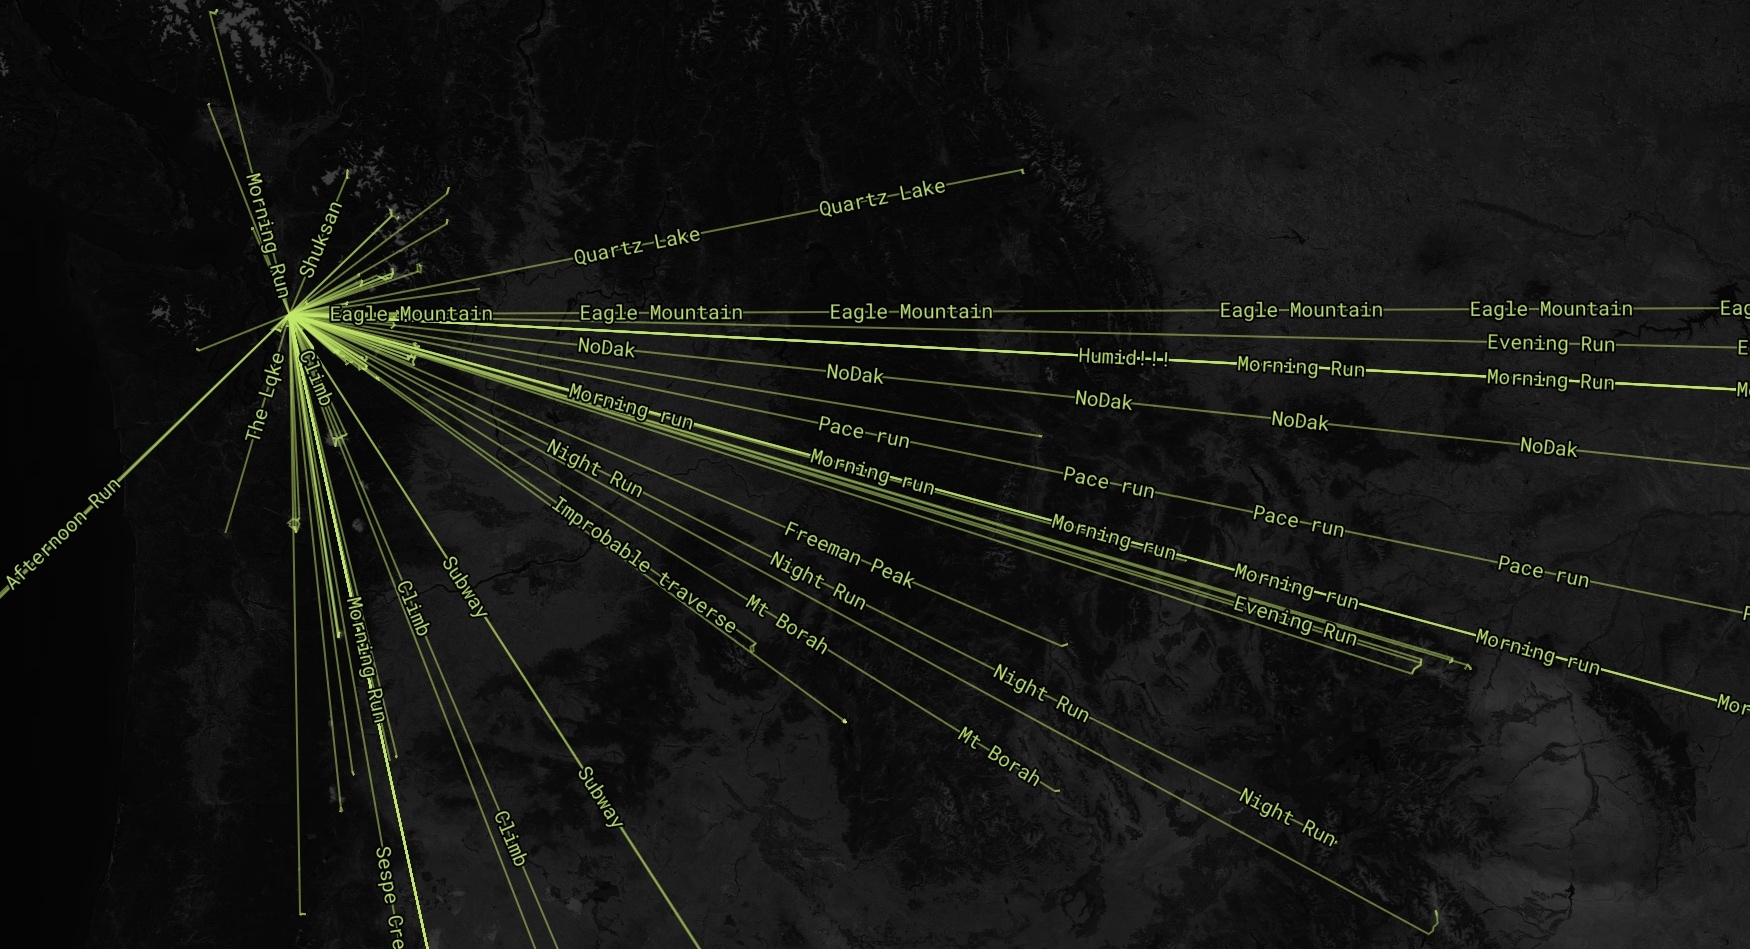
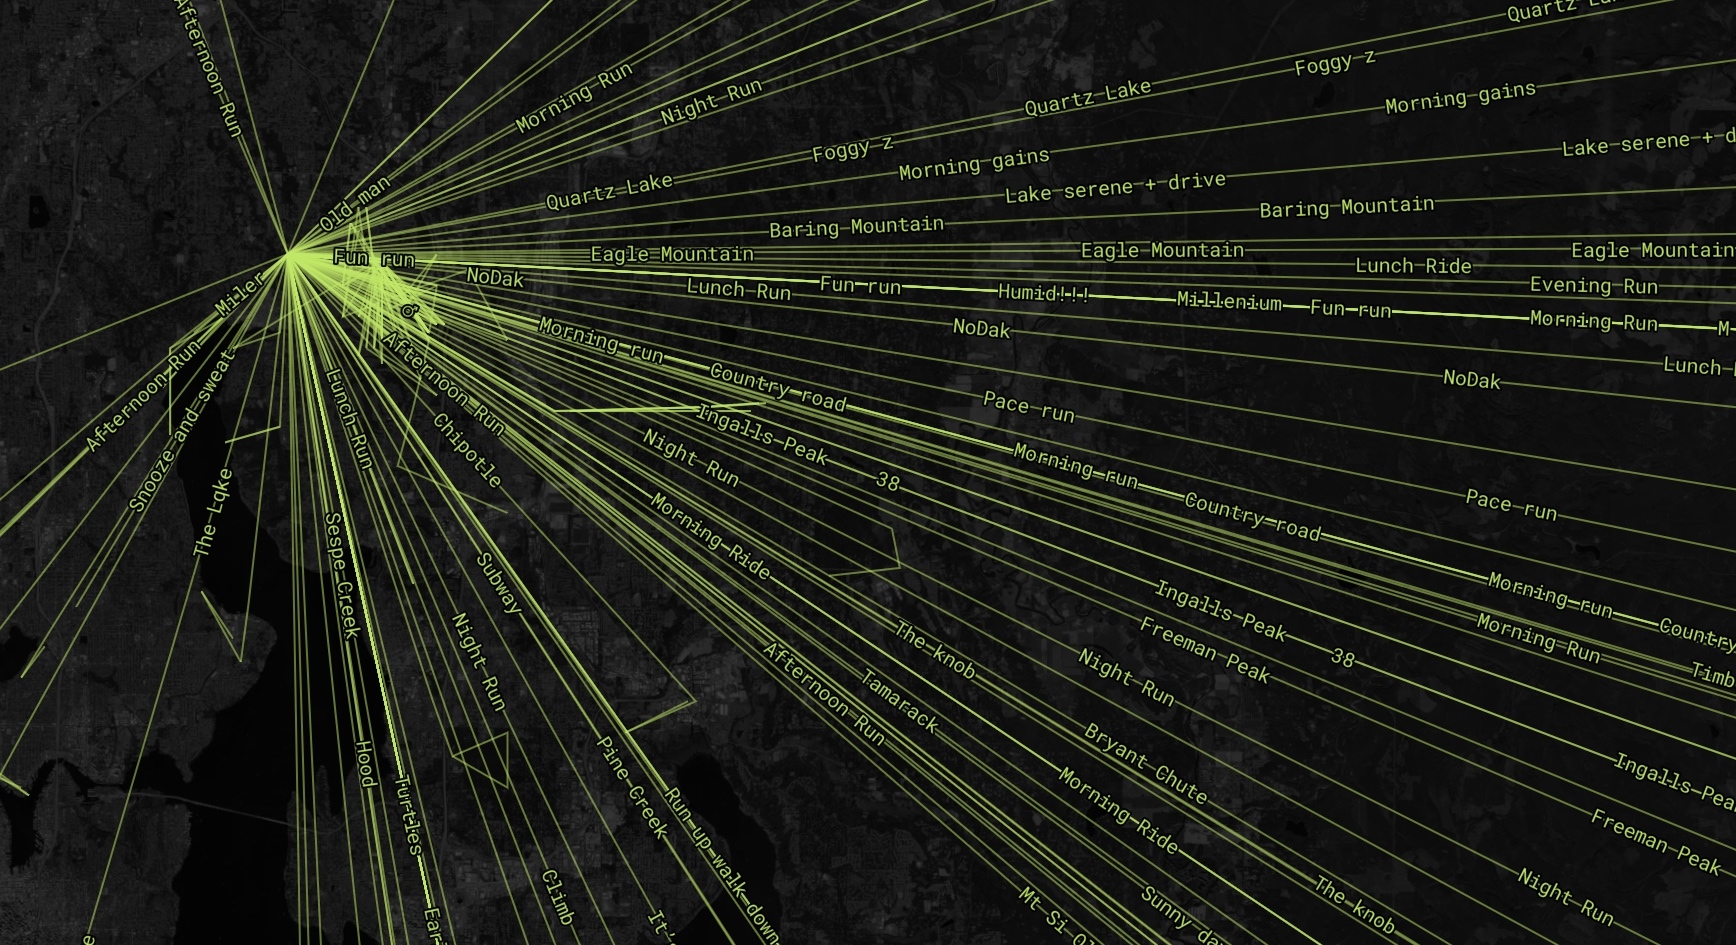
For this challenge, participants are asked to generate map tiles between zoom level 0-5, because these are free to create. If you want more detailed data at higher zoom levels, it will cost you to generate the tiles. In order to make my routes more visible, I added a straight line from my home base (Bothell, WA), to the start of each trailhead. This created the nice effect seen in the image at the top of this post. Here it is more up close:
The good news is that even if you generate your tiles for zoom levels 0-5, they will display all the way down to zoom level 22 (this is called overzooming), but detail will be lost. For example, when overzoomed, the route I took up Mt. Rainier looks like two straight lines.

Of course, if you choose to pay and make it available at higher zoom, you would see the route zigzagging back and forth in extreme detail.
Mapbox lets you configure your custom tile set using recipes. Here is a recipe that specifies that the tile set should only be generated for zoom level 0-5:
{
    "version": 1,
    "layers": {
        "maptober-strava-ted": {
            "source": "mapbox://tileset-source/tppiotrowski/strava-ted",
            "minzoom": 0,
            "maxzoom": 5,
        }
    }
}
My Strava data was quite raw and included a lot of superflous data, like the type of GPS I used to track my route or how many comments and kudos I had on an activity. Another feature of recipes is that you can choose to exclude data that you uploaded in your original GeoJSON. I only cared about distance, elevation and time so I set those attributes as allowed_output:
{
    "version": 1,
    "layers": {
        "maptober-strava-ted": {
            "source": "mapbox://tileset-source/tppiotrowski/strava-ted",
            "minzoom": 0,
            "maxzoom": 5,
            "features": {
                "attributes": {
                    "allowed_output": [
                        "distance",
                        "elapsed_time",
                        "total_elevation_gain",
                    ]
                }
            }
        }
    }
}
Omitting all the other data caused a nice reduction in tile size, which will improve download speeds for anyone wishing to load my Strava map. It’s also important because Mapbox has a maximum tile size limit of 1250kb. After filtering out unnecessary data, my tile data size went from 64kb to 11kb at zoom level 0. Mapbox provides you a nice graph showing your tile sizes at different zooms. My tile sizes before and after excluding superfluous data:

One other cool thing you can do with recipes is to transform your raw data. Strava data uses the metric system, but I’m more used to thinking about distances in miles and elevation gain in feet. To solve this, you can create computed properties that are calculated from the raw data. Here is what I used to convert distance, elevation and time:
... omitted
                "attributes": {
                    "set": {
                        "distance_miles": [
                            "*",
                            [
                                "get",
                                "distance"
                            ],
                            0.000621371
                        ],
                        "elevation_gain_feet": [
                            "*",
                            [
                                "get",
                                "total_elevation_gain"
                            ],
                            3.28084
                        ],
                        "total_time_hours": [
                            "/",
                            [
                                "get",
                                "elapsed_time"
                            ],
                            3600
                        ]
                    },
... omitted
And that about wraps up the exercise. The code is available here. Also, I’d like to apologise for using the default activity names of Morning Run, Evening Run, Night Run because it makes the map a bit less interesting.