Summer update on Shade Map
It’s already mid October, so the summer update is bleeding into fall. Here’s a traffic update and three things I managed to accomplish over the summer months.
Traffic #

shademap.app had just under 9,000 visitors over the summer months versus 2,000 visitors during spring. The spikes in the chart are an occasional mention on Hacker News or Reddit.
My biggest stress in the spring was paying the bill for map tiles, but everything turned out okay when I switched from using PNG image tiles to vector based tiles. Where before I was paying close to $100 a month, I can now serve up to 50,000 visitors per month using Mapbox’s free-tier. Along the way I released react-leaflet-vector-tile-layer for rendering vector tiles since I couldn’t find an existing solution.
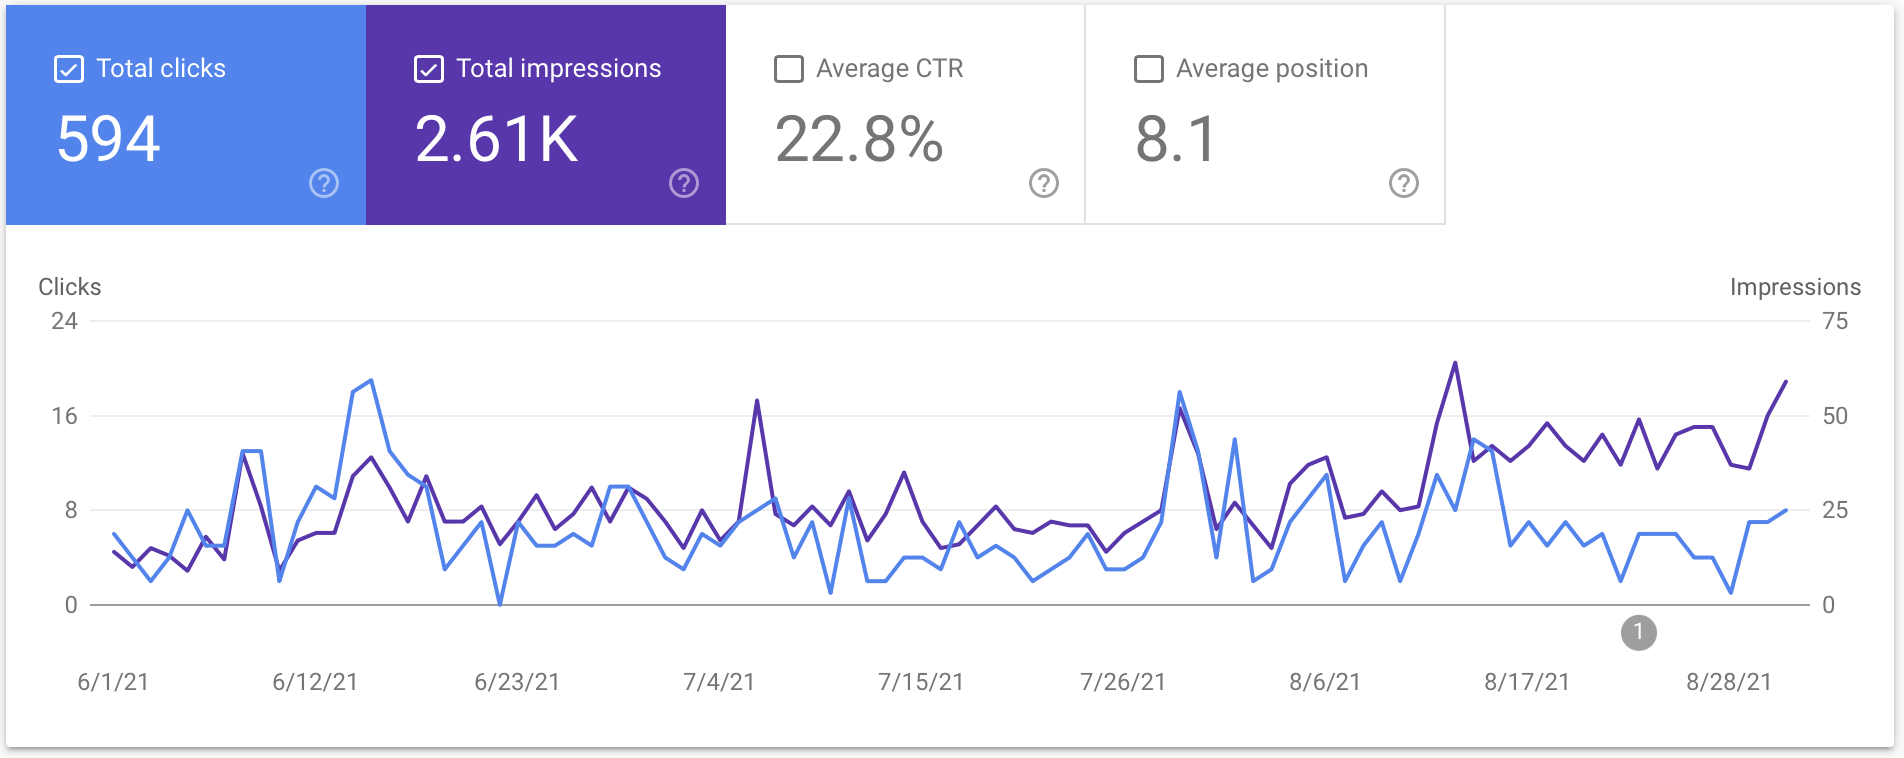
Google traffic has also been increasing nicely. I am number one for shademap and shade map keywords and in the top 5 results for about two dozen more. Based on the increasing interest in searches for shade map, I am assuming that even if people do not use the map initially they know of its existence and Google it when needed. The increasing number of impressions mean that Shade Map is now in the results for more keywords. Search impressions went from 500 to 2500 and clicks from 150 to 600.
HiDPI support #
Many devices like the iPhone and MacBook Pro ship with HiDPI displays. These displays quadruple or more the number of pixels on a screen. At the beginning of summer I implemented some strategies to speed up my shade calculations to 60 frames per second. This meant that I could achieve 15 frames per second in HiDPI mode. It’s not super smooth, but I’ve now added a High Quality setting for HiDPI screens and it looks beautiful. Here is a screenshot of the comparison, HiDPI on right:

Plugins and API #
During the summer, the CTO of a not-so-small prop tech company connected with me on LinkedIn. They were interested in using a Shade Map overlay in a mapping product to help customers get a feel for the terrain of a potential property. We had a nice 30 minute phone call where I shared some technical details and he said he would be in touch. Then he ghosted.
// Sample code to add a shade layer to Leaflet
let now = new Date(1633358583454);
const shadeMap = L.shadeMap({
    date: now,
    color: '#01112f',
    opacity: 0.7,
    apiKey: "1e4a17816006654bXXXXXXXXXXXX"
}).addTo(map);
I’ll admit that it was a little disappointing, but it got me thinking about how Shade Map could be used by other companies and developers to augment their existing maps. I decided to tear out the core functionality and make it pluggable into existing mapping solutions like Leaflet, Mapbox and Google Maps. I started with Leaflet, since it is what I use on shademap.app. The code is now pluggable into any Leaflet map. I threw together a basic landing page and demo, but have not received any requests for an API key yet. I’m looking at you AllTrails.
GPX Replay #
One thing I learned working at startups is that you create your own supply AND demand. You basically create something and sell it to yourself. Then you can tell your investors you have customers. It also helps to iron out any kinks your future customers might run into. Another term for this is ‘eating your own dog food’ or ‘dogfooding’. Since I recently built a Shade Map Leaflet plugin, I decided to test it out on a new mapping project.
I call it GPX Replay and it’s a viewer for GPS tracks with one small twist: you can watch the mountains shadows shifting over the course of the day. Move the slider in the example below and notice how day turns to night and then day again during an overnight climb of Mt. Rainier we did this summer:
I’ve always had a hard time visualising the passage of time when viewing my GPX tracks. I wanted a better way to relive the moment and stimulate memories of what the day was like. Plus Cassondra and I have done many alpine starts over the summer and I wanted to see where we were when the sun was rising and setting. You can try it with your own GPX file at https://shademap.app/gpxreplay/
Future work #
I would really like to build a text based API for querying shade information. I want to use it for things like querying the actual sunrise/sunset time for any given latitude/longitude. Then I can just feed it a spreadsheet of all the mountain peak coordinates in Washington and get precise sunrise/sunset times. I’m thinking something like mountain-forecast.com but for sunrises instead of weather…