Adding buildings to Shade Map

I added buildings to Shade Map (may take a few seconds to load)
From the beginning, Shade Map used contour maps in order to calculate which valleys are in the shade and which hill tops are in the sun. However, most cities are relatively flat and the main contributor to shade in these areas are buildings. I stumbled across a free GeoJSON API for buildings and decided to add buildings to Shade Map.
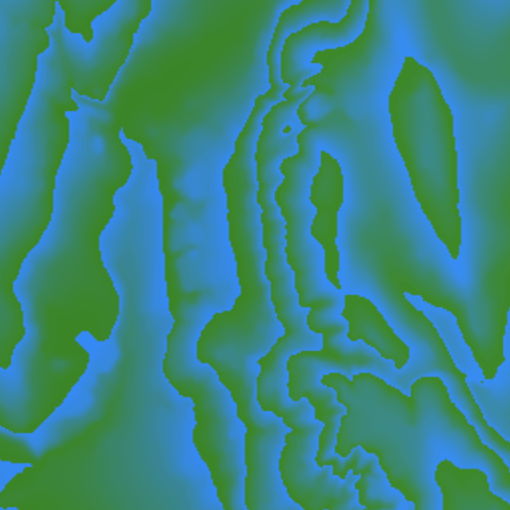
The elevation data I use for shading mountains and valleys is encoded in an image. Each pixel of the image corresponds to an elevation at that point. Here is an example elevation data map tile:
In contrast, the building data comes is GeoJSON format which is a text representation. Here is an example:
{
            "id": "27915177",
            "type": "Feature",
            "properties": {
                "levels": 2,
                "type": "school",
                "roofLevels": 0
            },
            "geometry": {
                "type": "Polygon",
                "coordinates": [
                    [
                        [-122.158889,47.743412],
                        [-122.158889,47.743695],
                        [-122.158417,47.743695],
                        [-122.158417,47.743412],
                        [-122.158889,47.743412]
                    ]
                ]
            }
        }
In order to use the data, I convert the GeoJSON information into an image tile where I draw the area of the building and fill its pixels with the corresponding height. Then I combine the elevation image tile with the building image tile to get a final elevation tile with buildings included.
Some limitations are that building data is only available for zoom levels 15-17. The free api is slow and often times-out leaving some city blocks without any shadows at all. 3dbuildings looks like a promising alternative but no free plan yet. Due to anti-aliasing when converting GeoJSON into an image the buildings lines are not clean and shadow spikes appear in their shadows.
My next step is to extract the building data from Open Street Maps myself and make a reliable API which combines elevation data and building data in a single set of tiles. This will significantly reduce loading times.